
Chart shapes: bowl, bucket, locomotive, splash
Seven named distributions, and a scheme where most charts fit two of them at once.
2 min read · Published 29 August 2026
Straight to it
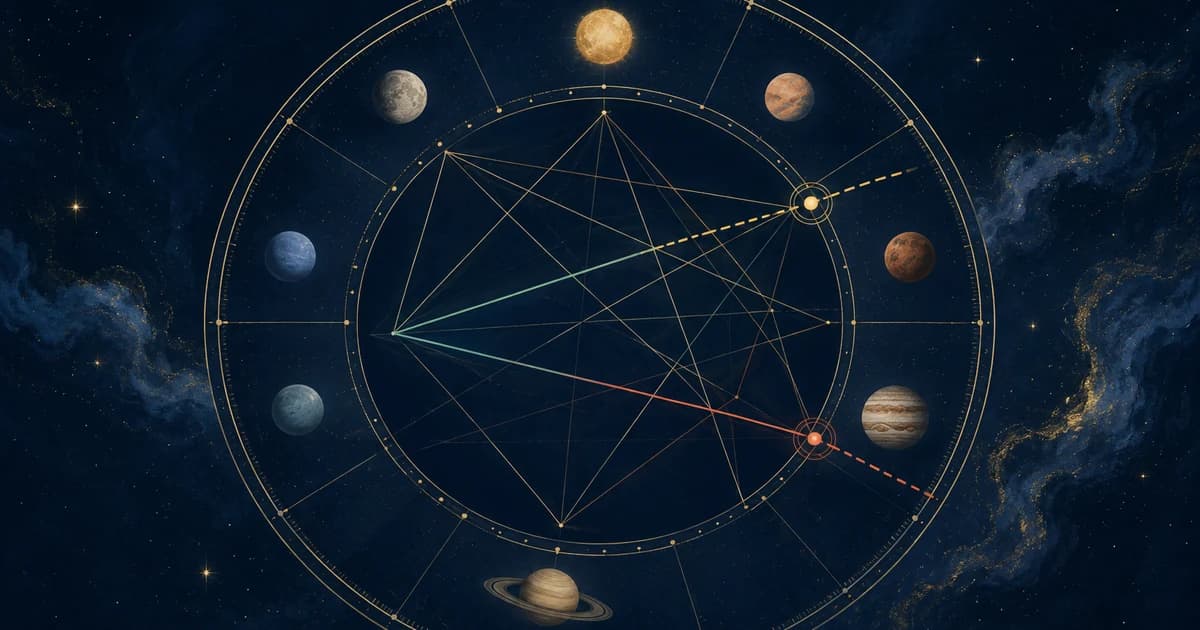
Chart shapes describe how the ten planets distribute around the wheel. The seven standard patterns are bowl, bucket, bundle, locomotive, seesaw, splash and splay, formalised by Marc Edmund Jones in the twentieth century. The scheme's weakness is that many charts fit no pattern cleanly, and the one a practitioner assigns often depends on judgement, not a rule.
The seven patterns
| Shape | Distribution | Traditionally read as |
|---|---|---|
| Bundle | All ten within about 120° | Highly focused, specialised, narrow but deep |
| Bowl | All ten within about 180° | A sense of something missing; self-contained |
| Bucket | A bowl plus one planet opposite: the handle | The handle planet becomes the chart's outlet and focus |
| Locomotive | All ten within about 240°, with an empty third | Driven, self-propelled, led by the leading planet |
| Seesaw | Two groups opposite each other | Balancing opposing demands; awareness of both sides |
| Splash | Spread evenly around the wheel | Broad interests, many directions, risk of dispersal |
| Splay | Irregular clumps with no even spread | Strongly individual, resistant to categorisation |
The bucket is the one practitioners value most, because it names a single planet as the chart's outlet.
The arithmetic problem
Mercury never strays more than about 28 degrees from the Sun, and Venus never more than about 47. Three of the ten are always clustered, so a true splash is close to impossible. The outer planets move so slowly that everyone born within a few years shares them, so a large part of a chart's shape is decided by birth era.
I would skip chart shapes altogether. Marc Edmund Jones drew seven patterns on ten dots, and most charts fit two of them at once.
Where the scheme came from
Jones formalised the seven patterns in the same body of work that produced the Sabian symbols. Looking at overall distribution first is good practice. Whether the attached meanings hold is the usual answer: no study, one person, one century.
How to use it
- Look at the shape first. It takes seconds.
- Notice real emptiness. A large empty region is a feature whatever you call the shape.
- Find the handle if there is one.
- Do not force a classification.
AsterNym computes stelliums and aspect patterns and states the thresholds used.
The follow-ups
- What are the chart shapes in astrology?
- Bundle, bowl, bucket, locomotive, seesaw, splash and splay. Marc Edmund Jones formalised them in the twentieth century.
- What is a bucket chart?
- A bowl plus a single planet opposite, called the handle, which is read as the chart's outlet.
- Are chart shapes reliable?
- The thresholds are conventions, so charts near an edge can be classified either way. There is no evidence for the meanings attached.
 Xavier Brooks